OADP monitoring
Monitor OADP operations by using the OpenShift Container Platform monitoring stack to create service monitors, configure alerting rules, and view metrics. This helps you track backup and restore performance, manage clusters, and receive alerts for important events.
OADP monitoring setup
Set up OADP monitoring by enabling User Workload Monitoring and configuring the OpenShift Container Platform monitoring stack to retrieve Velero metrics. This helps you create alerting rules, query metrics, and optionally visualize data by using Prometheus-compatible tools such as Grafana.
Monitoring metrics requires enabling monitoring for the user-defined projects and creating a ServiceMonitor resource to scrape those metrics from the already enabled OADP service endpoint in the openshift-adp namespace.
The OADP support for Prometheus metrics is offered on a best-effort basis and is not fully supported.
For more information about setting up the monitoring stack, see Configuring user workload monitoring.
Prerequisites
- You have access to an OpenShift Container Platform cluster using an account with
cluster-adminpermissions. - You have created a cluster monitoring config map.
Procedure
- Edit the
cluster-monitoring-configConfigMapobject in theopenshift-monitoringnamespace by using the following command:terminal$ oc edit configmap cluster-monitoring-config -n openshift-monitoring - Add or enable the
enableUserWorkloadoption in thedatasection’sconfig.yamlfield by using the following command:yamlapiVersion: v1 kind: ConfigMap data: config.yaml: | enableUserWorkload: true metadata: # ...where:
enableUserWorkloadAdd this option or set to
true.
- Wait a short period to verify the User Workload Monitoring Setup by checking that the following components are up and running in the
openshift-user-workload-monitoringnamespace:terminal$ oc get pods -n openshift-user-workload-monitoringterminalNAME READY STATUS RESTARTS AGE prometheus-operator-6844b4b99c-b57j9 2/2 Running 0 43s prometheus-user-workload-0 5/5 Running 0 32s prometheus-user-workload-1 5/5 Running 0 32s thanos-ruler-user-workload-0 3/3 Running 0 32s thanos-ruler-user-workload-1 3/3 Running 0 32s - Verify the existence of the
user-workload-monitoring-configConfigMap in theopenshift-user-workload-monitoring. If it exists, skip the remaining steps in this procedure.terminal$ oc get configmap user-workload-monitoring-config -n openshift-user-workload-monitoringterminalError from server (NotFound): configmaps "user-workload-monitoring-config" not found - Create a
user-workload-monitoring-configConfigMapobject for the User Workload Monitoring, and save it under the2_configure_user_workload_monitoring.yamlfile name:yamlapiVersion: v1 kind: ConfigMap metadata: name: user-workload-monitoring-config namespace: openshift-user-workload-monitoring data: config.yaml: | - Apply the
2_configure_user_workload_monitoring.yamlfile by using the following command:terminal$ oc apply -f 2_configure_user_workload_monitoring.yaml configmap/user-workload-monitoring-config created
Creating OADP service monitor
Create a ServiceMonitor resource to scrape Velero metrics from the OADP service endpoint. This helps you collect metrics for monitoring backup and restore operations in the OpenShift Container Platform monitoring stack.
OADP provides an openshift-adp-velero-metrics-svc service. The user workload monitoring service monitor must use the openshift-adp-velero-metrics-svc service.
Procedure
- Ensure that the
openshift-adp-velero-metrics-svcservice exists. It should containapp.kubernetes.io/name=velerolabel, which is used as selector for theServiceMonitorobject.terminal$ oc get svc -n openshift-adp -l app.kubernetes.io/name=veleroExample outputNAME TYPE CLUSTER-IP EXTERNAL-IP PORT(S) AGE openshift-adp-velero-metrics-svc ClusterIP 172.30.38.244 <none> 8085/TCP 1h - Create a
ServiceMonitorYAML file that matches the existing service label, and save the file as3_create_oadp_service_monitor.yaml. The service monitor is created in theopenshift-adpnamespace which has theopenshift-adp-velero-metrics-svcservice.yamlapiVersion: monitoring.coreos.com/v1 kind: ServiceMonitor metadata: labels: app: oadp-service-monitor name: oadp-service-monitor namespace: openshift-adp spec: endpoints: - interval: 30s path: /metrics targetPort: 8085 scheme: http selector: matchLabels: app.kubernetes.io/name: "velero" - Apply the
3_create_oadp_service_monitor.yamlfile:terminal$ oc apply -f 3_create_oadp_service_monitor.yamlExample outputservicemonitor.monitoring.coreos.com/oadp-service-monitor created
Verification
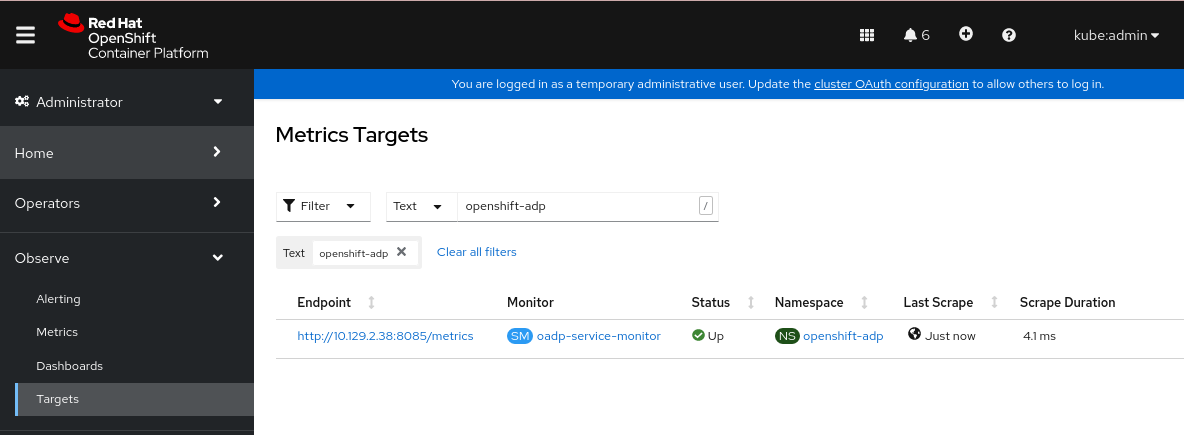
- Confirm that the new service monitor is in an Up state by using the Administrator perspective of the OpenShift Container Platform web console. Wait a few minutes for the service monitor to reach the Up state.
- Navigate to the Observe → Targets page.
- Ensure the Filter is unselected or that the User source is selected and type
openshift-adpin theTextsearch field. - Verify that the status for the Status for the service monitor is Up.
Figure 1. OADP metrics targets
Creating an alerting rule
Create a PrometheusRule resource to configure alerting rules for OADP backup operations. This helps you receive notifications when backup failures or other issues occur in your environment.
The OpenShift Container Platform monitoring stack receives alerts configured by using alerting rules. To create an alerting rule for the OADP project, use one of the metrics scraped with the user workload monitoring.
Procedure
- Create a
PrometheusRuleYAML file with the sampleOADPBackupFailingalert and save it as4_create_oadp_alert_rule.yaml:yamlapiVersion: monitoring.coreos.com/v1 kind: PrometheusRule metadata: name: sample-oadp-alert namespace: openshift-adp spec: groups: - name: sample-oadp-backup-alert rules: - alert: OADPBackupFailing annotations: description: 'OADP had {{$value | humanize}} backup failures over the last 2 hours.' summary: OADP has issues creating backups expr: | increase(velero_backup_failure_total{job="openshift-adp-velero-metrics-svc"}[2h]) > 0 for: 5m labels: severity: warningIn this sample, the Alert displays under the following conditions:
- During the last 2 hours, the number of new failing backups was greater than 0 and the state persisted for at least 5 minutes.
- If the time of the first increase is less than 5 minutes, the Alert is in a
Pendingstate, after which it turns into aFiringstate.
- Apply the
4_create_oadp_alert_rule.yamlfile, which creates thePrometheusRuleobject in theopenshift-adpnamespace:terminal$ oc apply -f 4_create_oadp_alert_rule.yamlExample outputprometheusrule.monitoring.coreos.com/sample-oadp-alert created
Verification
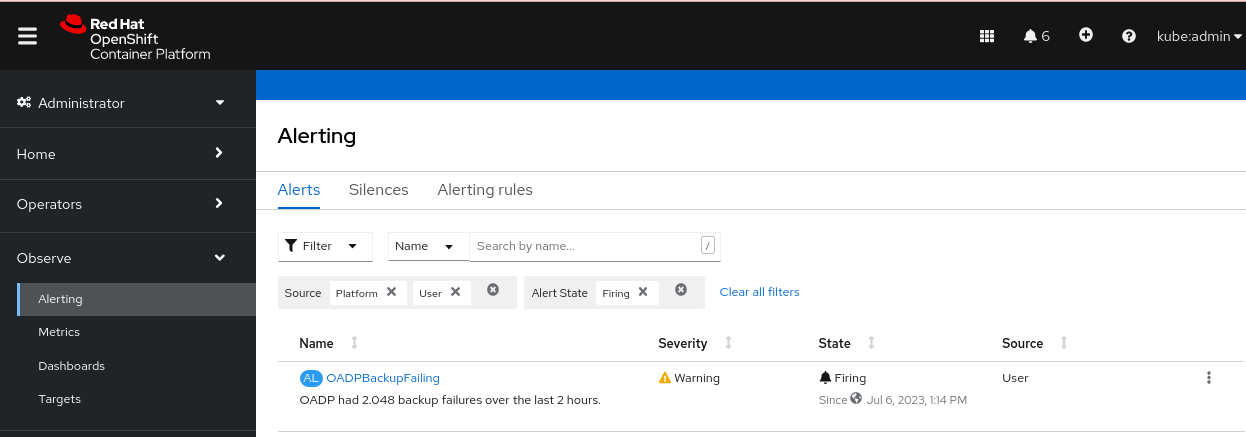
- After the Alert is triggered, you can view it in the following ways:
- In the Developer perspective, select the Observe menu.
- In the Administrator perspective under the Observe → Alerting menu, select User in the Filter box. Otherwise, by default only the Platform Alerts are displayed.
Figure 2. OADP backup failing alert
List of available metrics
Review the following table for a list of Velero metrics provided by OADP together with their Types:
Velero metrics
| Metric name | Description | Type |
|---|---|---|
velero_backup_tarball_size_bytes | Size, in bytes, of a backup | Gauge |
velero_backup_total | Current number of existent backups | Gauge |
velero_backup_attempt_total | Total number of attempted backups | Counter |
velero_backup_success_total | Total number of successful backups | Counter |
velero_backup_partial_failure_total | Total number of partially failed backups | Counter |
velero_backup_failure_total | Total number of failed backups | Counter |
velero_backup_validation_failure_total | Total number of validation failed backups | Counter |
velero_backup_duration_seconds | Time taken to complete backup, in seconds | Histogram |
velero_backup_duration_seconds_bucket | Total count of observations for a bucket in the histogram for the metric velero_backup_duration_seconds | Counter |
velero_backup_duration_seconds_count | Total count of observations for the metric velero_backup_duration_seconds | Counter |
velero_backup_duration_seconds_sum | Total sum of observations for the metric velero_backup_duration_seconds | Counter |
velero_backup_deletion_attempt_total | Total number of attempted backup deletions | Counter |
velero_backup_deletion_success_total | Total number of successful backup deletions | Counter |
velero_backup_deletion_failure_total | Total number of failed backup deletions | Counter |
velero_backup_last_successful_timestamp | Last time a backup ran successfully, UNIX timestamp in seconds | Gauge |
velero_backup_items_total | Total number of items backed up | Gauge |
velero_backup_items_errors | Total number of errors encountered during backup | Gauge |
velero_backup_warning_total | Total number of warned backups | Counter |
velero_backup_last_status | Last status of the backup. A value of 1 is success, 0 is failure | Gauge |
velero_restore_total | Current number of existent restores | Gauge |
velero_restore_attempt_total | Total number of attempted restores | Counter |
velero_restore_validation_failed_total | Total number of failed restores failing validations | Counter |
velero_restore_success_total | Total number of successful restores | Counter |
velero_restore_partial_failure_total | Total number of partially failed restores | Counter |
velero_restore_failed_total | Total number of failed restores | Counter |
velero_volume_snapshot_attempt_total | Total number of attempted volume snapshots | Counter |
velero_volume_snapshot_success_total | Total number of successful volume snapshots | Counter |
velero_volume_snapshot_failure_total | Total number of failed volume snapshots | Counter |
velero_csi_snapshot_attempt_total | Total number of CSI attempted volume snapshots | Counter |
velero_csi_snapshot_success_total | Total number of CSI successful volume snapshots | Counter |
velero_csi_snapshot_failure_total | Total number of CSI failed volume snapshots | Counter |
Viewing metrics using the Observe UI
Review metrics in the OpenShift Container Platform web console from the Administrator or Developer perspective, which must have access to the openshift-adp project.
Procedure
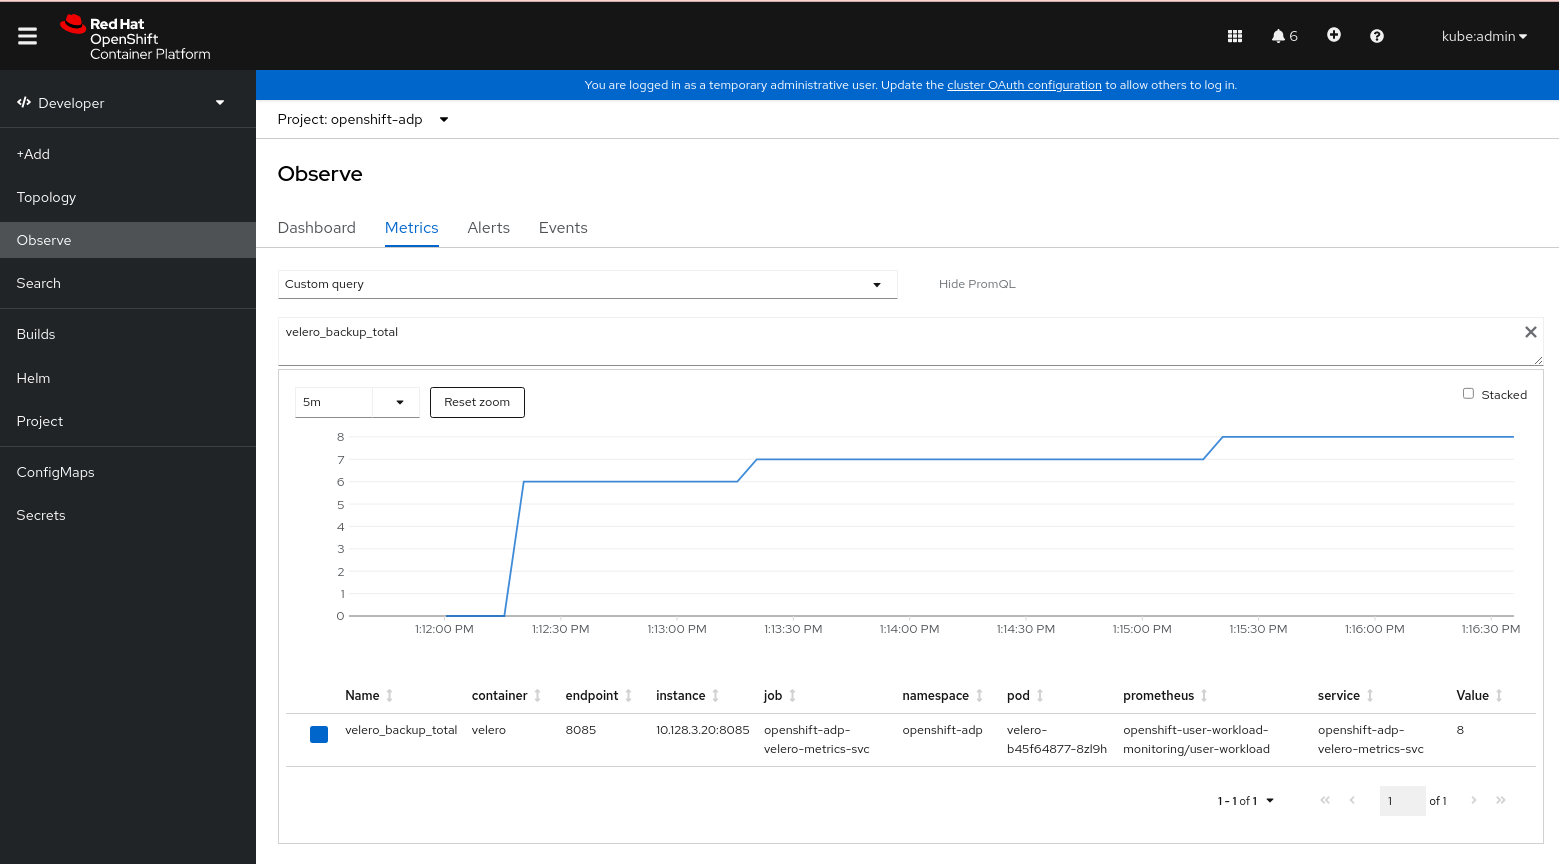
- Navigate to the Observe → Metrics page:
- If you are using the Developer perspective, follow these steps:
- Select Custom query, or click the Show PromQL link.
- Type the query and click Enter.
- If you are using the Administrator perspective, type the expression in the text field and select Run Queries.
Figure 3. OADP metrics query
- If you are using the Developer perspective, follow these steps: